While it is common for businesses to maintain regular cash flow forecasting procedures, the natural extension of applying risk analytics in a comprehensive, consistent format is an often under utilised value-add operation.
Once cash flow forecasting is completed and sources of risk exposures wholly identified, the next step is to understand the potential cash flow and profitability impact of unhedged market volatility in order to make informed risk management decisions within a broader strategic commercial context.
Financial modelling empowers a treasury function to:
- Understand the extent that various internal exposures offset one another
- Stress test how a risk management policy performs in various macroeconomic environments
- Assess how to manage long dated exposures
- Optimise annual budget rates
- Present a business case to drive change in your organisation
- Proactively monitor, report and react to changes in market risk factors
While no model or technique will wholly capture all market risks, the application of a consistent and thorough modelling process provides a recognisable foundation for stakeholders to base strategic decisions on as market and operational environments change over time.
Moreover, the accumulation of historic modelling output builds an asset for the business: a clean, consistent data set that can be leveraged in future management development and modelling requirements.
A consistent process also enables the luxury of back testing past quantified risk forecasts against realised gains and losses in a process that assesses the integrity of a modelling system. Back testing also enables effective development of scenarios for stress testing. For example, if over the past year, a model is deemed to be quantifying risk at a statistically acceptable level, model inputs can be tweaked and adjusted to assess combinations of parameters (say, rapidly increasing oil prices against a depreciating AUD) that produce risk in excess of historical tendencies. These more unlikely, yet highly risky scenarios can then be a strategy discussion point for a risk management committee to assess how the business would respond based on current credit lines and access to broader liquidity to withstand such an event.
The following is a brief, highly simplified example of how risk analytics can extend cash flow forecasting to develop an actionable risk management strategy
Risk Analytics Hedging Example
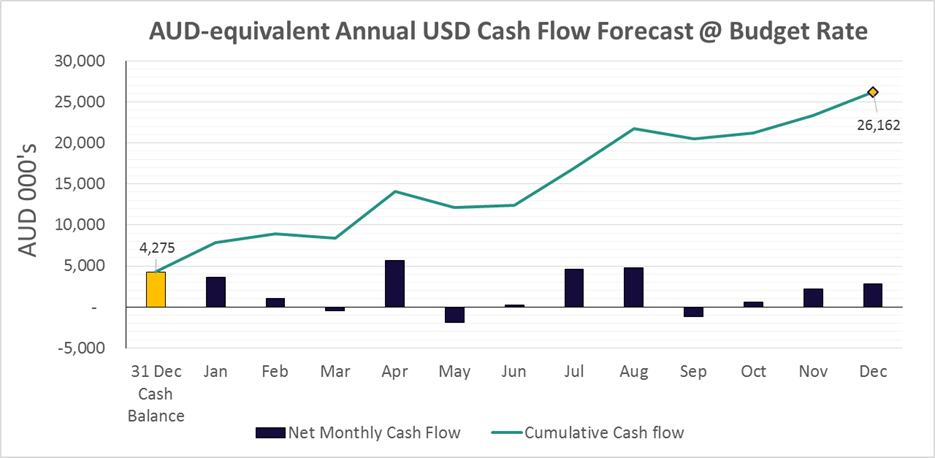
- The finance team of an Australian company produces the below annual USD forecast at an AUD/USD Budget Rate of 0.8000. Based on this forecast, USD income should contribute AUD 22m to year-end Group cash (end balance less starting balance)
- Assuming the procurement and sales teams hit their numbers, the above projection is still exposed to exchange rate fluctuations, particularly on the longer dated net receivables in July-August and November-December. With this in mind, statistical methods can be applied to a spot rate of 0.7700 that simulate thousands of potential paths in AUD/USD over the upcoming twelve months, which is shown below. One path is shown in blue to assist in visualising that this chart is comprised of thousands of individual price paths
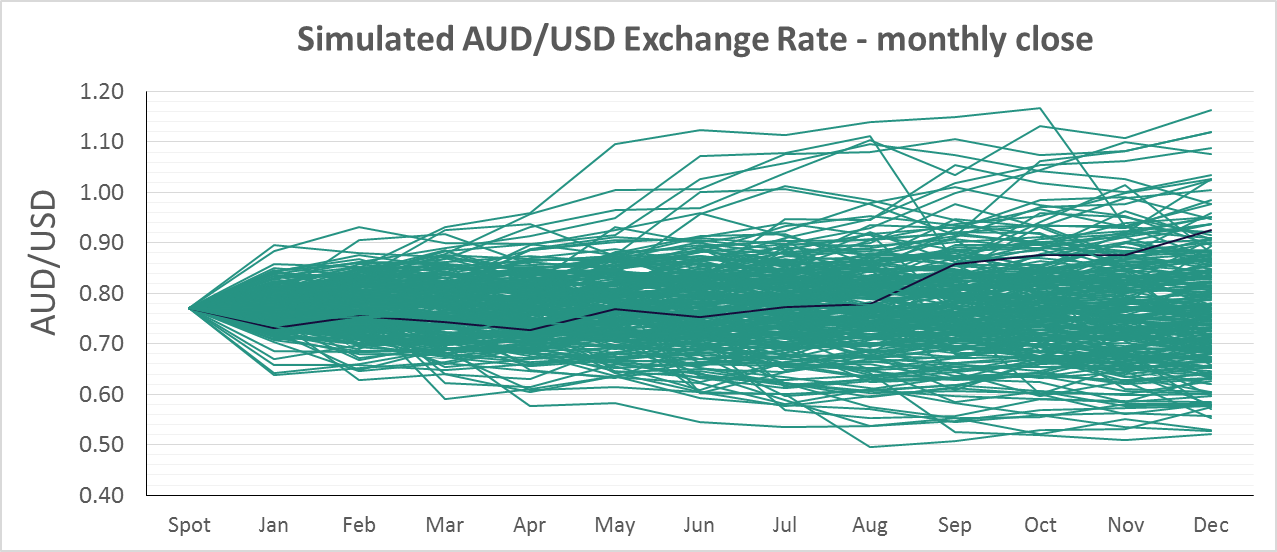
Simulated outcomes predominantly range between 0.6000 – 0.9000. However, the modelling also considers extreme events with pricing from 0.5400 – 1.1600, albeit with much less regularity
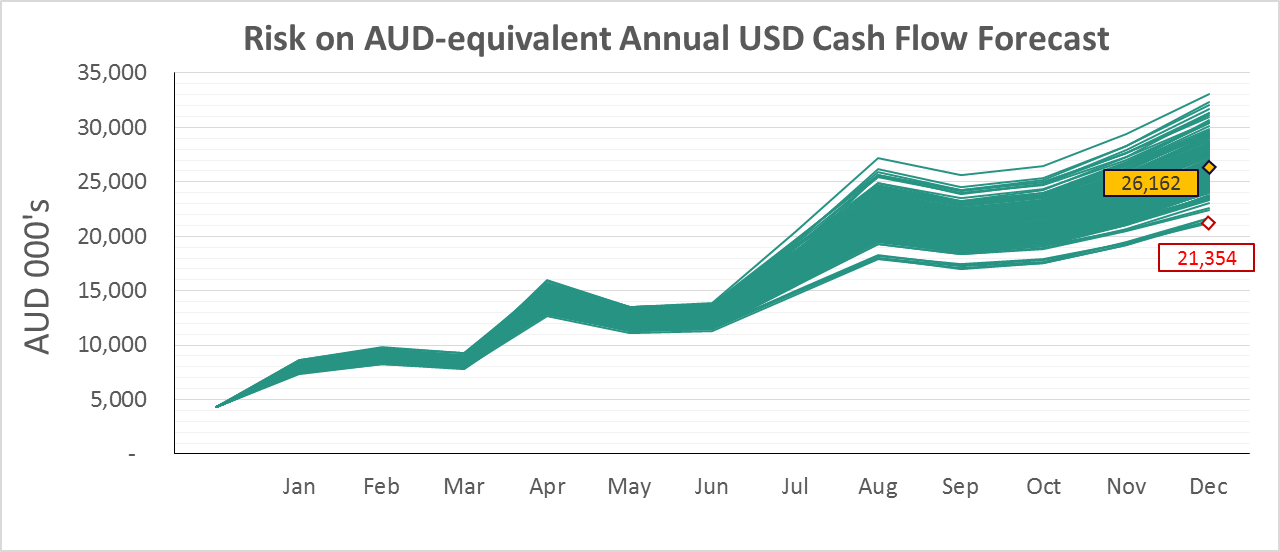
- When USD income in each month is converted to AUD based on the simulated exchange rates above, cumulative cash flow becomes a range of potential outcomes rather than the single line in the first diagram.
- While it may be obvious that foreign exchange movements have potential to adversely impact cashflow, what is also immediately clear in the below chart is the maximum expected AUD amount that this adverse impact could have. In this case, USD contribution to Group cash could be up to AUD 4m less than anticipated, equivalent to 4% of the expected balance.
Now, let’s extend this analysis with some simple assumptions:
- Trade working capital cannot dip below the year’s starting cash balance; overdraft facilities / short term credit lines are not considered
- The business has revenue in four other currencies, each with expected net AUD cash of $26m
- The company directors have planned AUD 120m of capex, dividends and debt payments to be made on 31 December of the upcoming year
- Each currency has risk of AUD 4m (the same as the USD exposures)
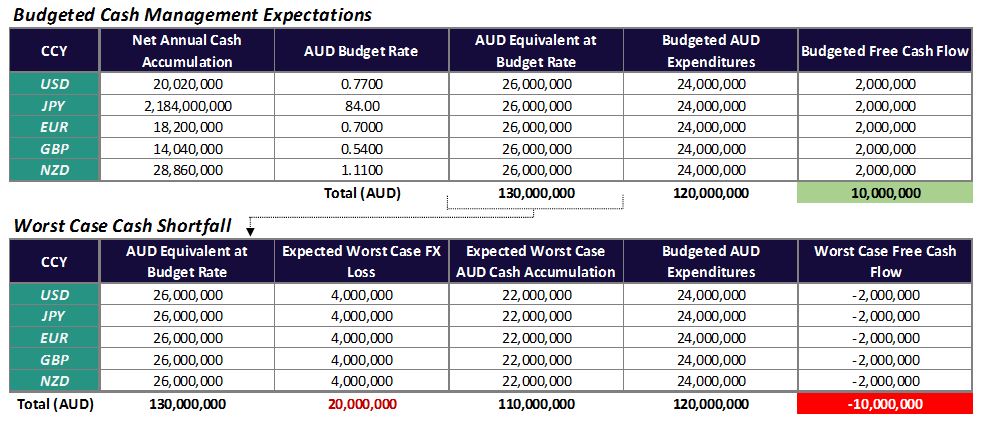
So, at the budget rate the Group will have AUD 10m in free cash flow at year-end ($130m net income – $120m planned expenditures). However, if the highest expected FX losses occur on all currencies, the Group will have AUD -10m in free cash flow at year-end ($110m net income – $120m planned expenditures).
Recommendation:
If the model output is strictly adhered to, hedging should be applied to cash flows throughout the year to the extent that hedge coverage brings the worst expected year-end Group cash balance up to $110m. In doing so, all planned expenditures can be funded.
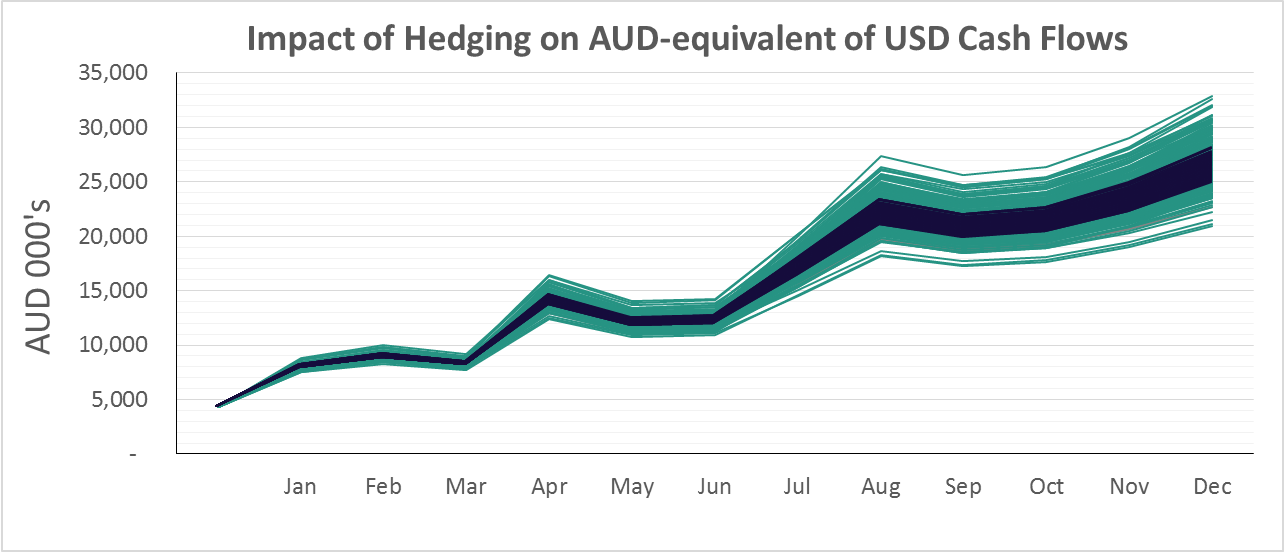
This effect of tightening the range of year-end Group cash outcomes is shown below on USD exposures as the blue range overlayed on top of the green range if approximately 80% of exposures are hedged on a three-month rolling basis.
In reality, this strategy is dependent on an array of factors such as natural hedges from internal operations, bargaining power in supply and sales contracts, available FX lines, potential capital regulations and access to short term liquidity (working capital, overdraft lines), to name a few.
If you enjoyed this article then access more Thought Leadership by Rochford here!
Thomas Alexander, ‘Lead Analyst – Advisory Team’ at Rochford, the leading treasury advisory house in Australia advising on in excess of AU$20 billion in financial market risk.
To find out more, visit: http://rochford-group.com/ or connect with Thomas on Linkedin.