Market Update: 16 April 2020
Sometimes it’s interesting to see commentators look for ways to fit the price action in markets. It can be a theme that’s driven them crazy about for days, let alone weeks (certainly, myself included) that will eventually be right… but not necessarily for the right reason.
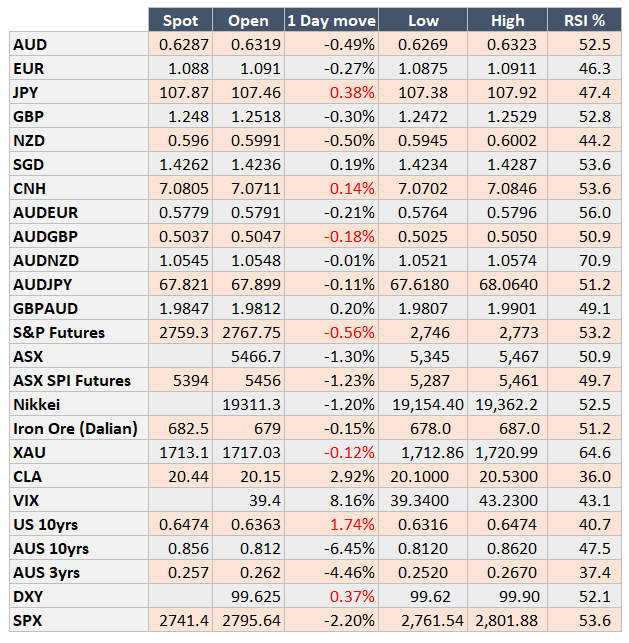
A firm rejection of the Elliott Wave at 2851 saw a 2.8% fall in total of S&P and buoyed USD higher across the board. AUD as low as 0.6286 and again the higher beta, losing some ground against the crosses.
The harsh reality of no-one getting out of the house – thus no flights, no driving … walking if you’re lucky, means less Oil consumption.. this rang true in the usual buy the rumour, sell the fact for Oil falling to $19.34 on demand concerns – rather than the OPEC+ obsessed supply. This move was used to fit the story of S&P lower alongside the economics catching up as US Bank earnings fell on debt provisioning.
US 10yr Treasurys have also fallen (rates) as a confirmation of risk aversion, but Gold fell too – perhaps given the 2009/10 GFC analogue in expectation of a Commodity Boom.
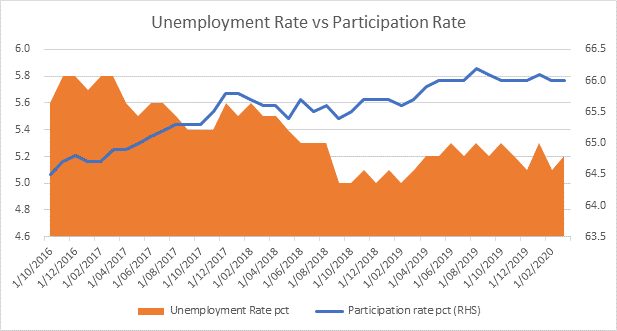
Where we haven’t yet seen too bad a number was in today’s Oz unemployment – a move from 5.1% to 5.2% for March (yet a gain of 5.9k jobs). Sounds great? Well sadly I’m going to use March 21 – the day they closed Bondi Beach as my starting point so the data capture will be more material in April. This also acknowledged by the ABS. What will slightly offset large numbers in unemployment will definitely be participation rate – see below a simplified chart how the participation rate will affect the unemployment rate (percentage of those of working age wanting to participate in the workforce).
So the Macro community remains bearish and for now, the Technical community does too. It won’t be a surprise to see a test lower for risk and that will include AUD. The difference this time (from last month) will be market participants. Macro tend towards medium/long term, whilst technical tend to be short term. Whomever is the bigger participant this time round will be the key driver.
LHS is the unemployment rate in orange, the participation rate RHS rose throughout that time.
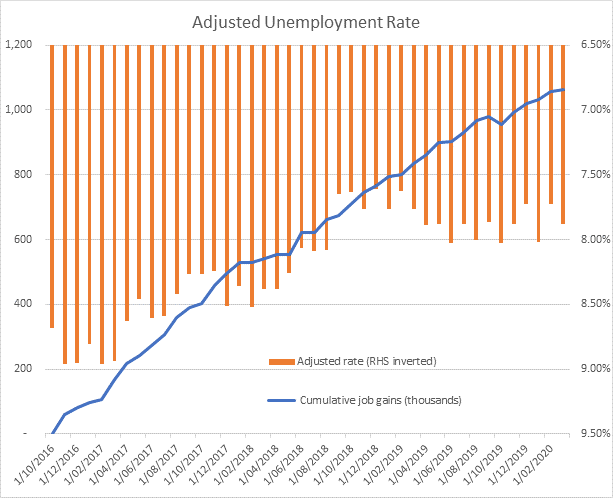
In a simple adjustment (Unemployment Rate/Participation Rate) RHS in Orange vs Cumulative Job gains (not adjusted for population growth). This shows despite an improvement in job gains, it’s not always reflected in the Unemployment rate – due to the Participation Rate.
2009/2010
Unemployment blue LHS vs Participation Rate white RHS shows the fall in Participation acted as a buffer to the true unemployment rate where March – June 2009 saw cumulative job losses of 49k, yet there was only a small uptick in unemployment.

Contact the Inside Track Research Team for more info: +61 2 8916 6115