Market Update: 28 May 2020
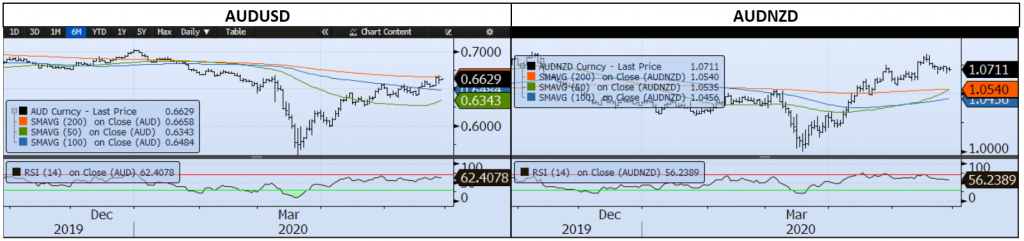
Friends, we are at an inflection point.. AUD, DXY, JPY, CHF all want direction. AUD is just short of the 200 DMA (Day Moving Average), DXY alongside and due to JPY and CHF are in a narrowing wedge pattern.
So whilst we’ve had pros and cons of the COVID recovery story with re-openings, potential vaccines, data that could be worse vs China vs US and Australia trade wars (including Hong Kong), lack of substantial evidence of a vaccine and US hitting 100,000 deaths, AUD has to figure out if the short-term traders will beat out the negative macro community and force stops above the 200DMA should it CLOSE above this level. Yes, we’ve broken it as high as 0.6680, but it needs to close above 0.6658 for a buy signal.
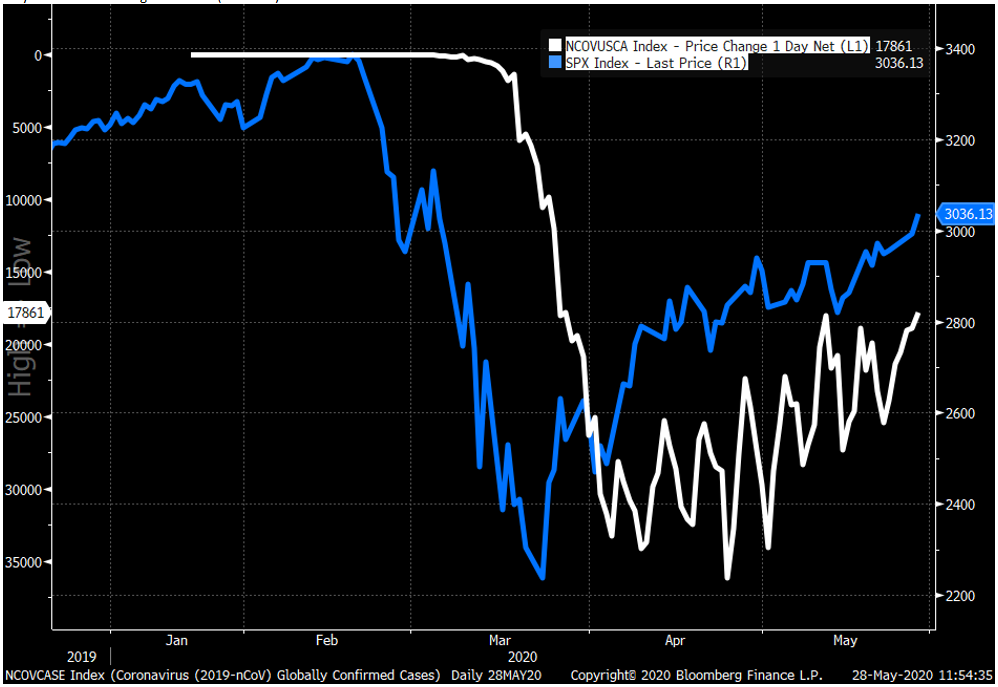
The correlations have also (just) broken down between AUD and S&P as US shares continue to concentrate on the positives and clearly breaks through its 200dma by 1.5%, whilst AUD has hesitated and suffered a small fall. This has of course happened many times before… but not in the past few weeks. Looking at the chart below, think back to Jan-Feb 2020.
Whilst the RBA tell us today – things aren’t as bad as they expected.. their expectations were pretty bad. I don’t think we’d celebrate a decline in jobs by 15% just because RBA thought it would be 20%, but it certainly changes their mindset on monetary policy and any idea of negative interest rates. This compared to other countries does give it slight advantage including over the ditch (NZD). Also Private CAPEX wasn’t as bad as forecast at -1.6% vs market -2.6% but it’s for Q1 and forecasts (are what matter most) show plans to spend 90.9B for 2020/21 vs mkt 95B and a significant drop from plans for 2019/20 at 115.4B.
So as the world reopens, but we get ongoing increases in COVID cases and reminders how infectious it is (Brazil had 241k cases a week ago and now stands at 411k, one South Korean man who had COVID managed to infect over 250 people at a nightclub), the markets vs real economy debate will continue to cause intra-day fluctuations and test market participants resolve to be patient, greedy or stop-out.
Put a different way, we’ve already experienced a V-shape market recovery, let’s see if the economy agrees!
A reminder S&P is representative of the US market – not the world, whilst AUD is a risk proxy for global growth and commodities.
Daily COVID cases Globally (Inverted) vs S&P and AUD

Daily COVID cases change in the US (inverted) vs S&P

Contact the Inside Track Research Team for more info: +61 2 8916 6115